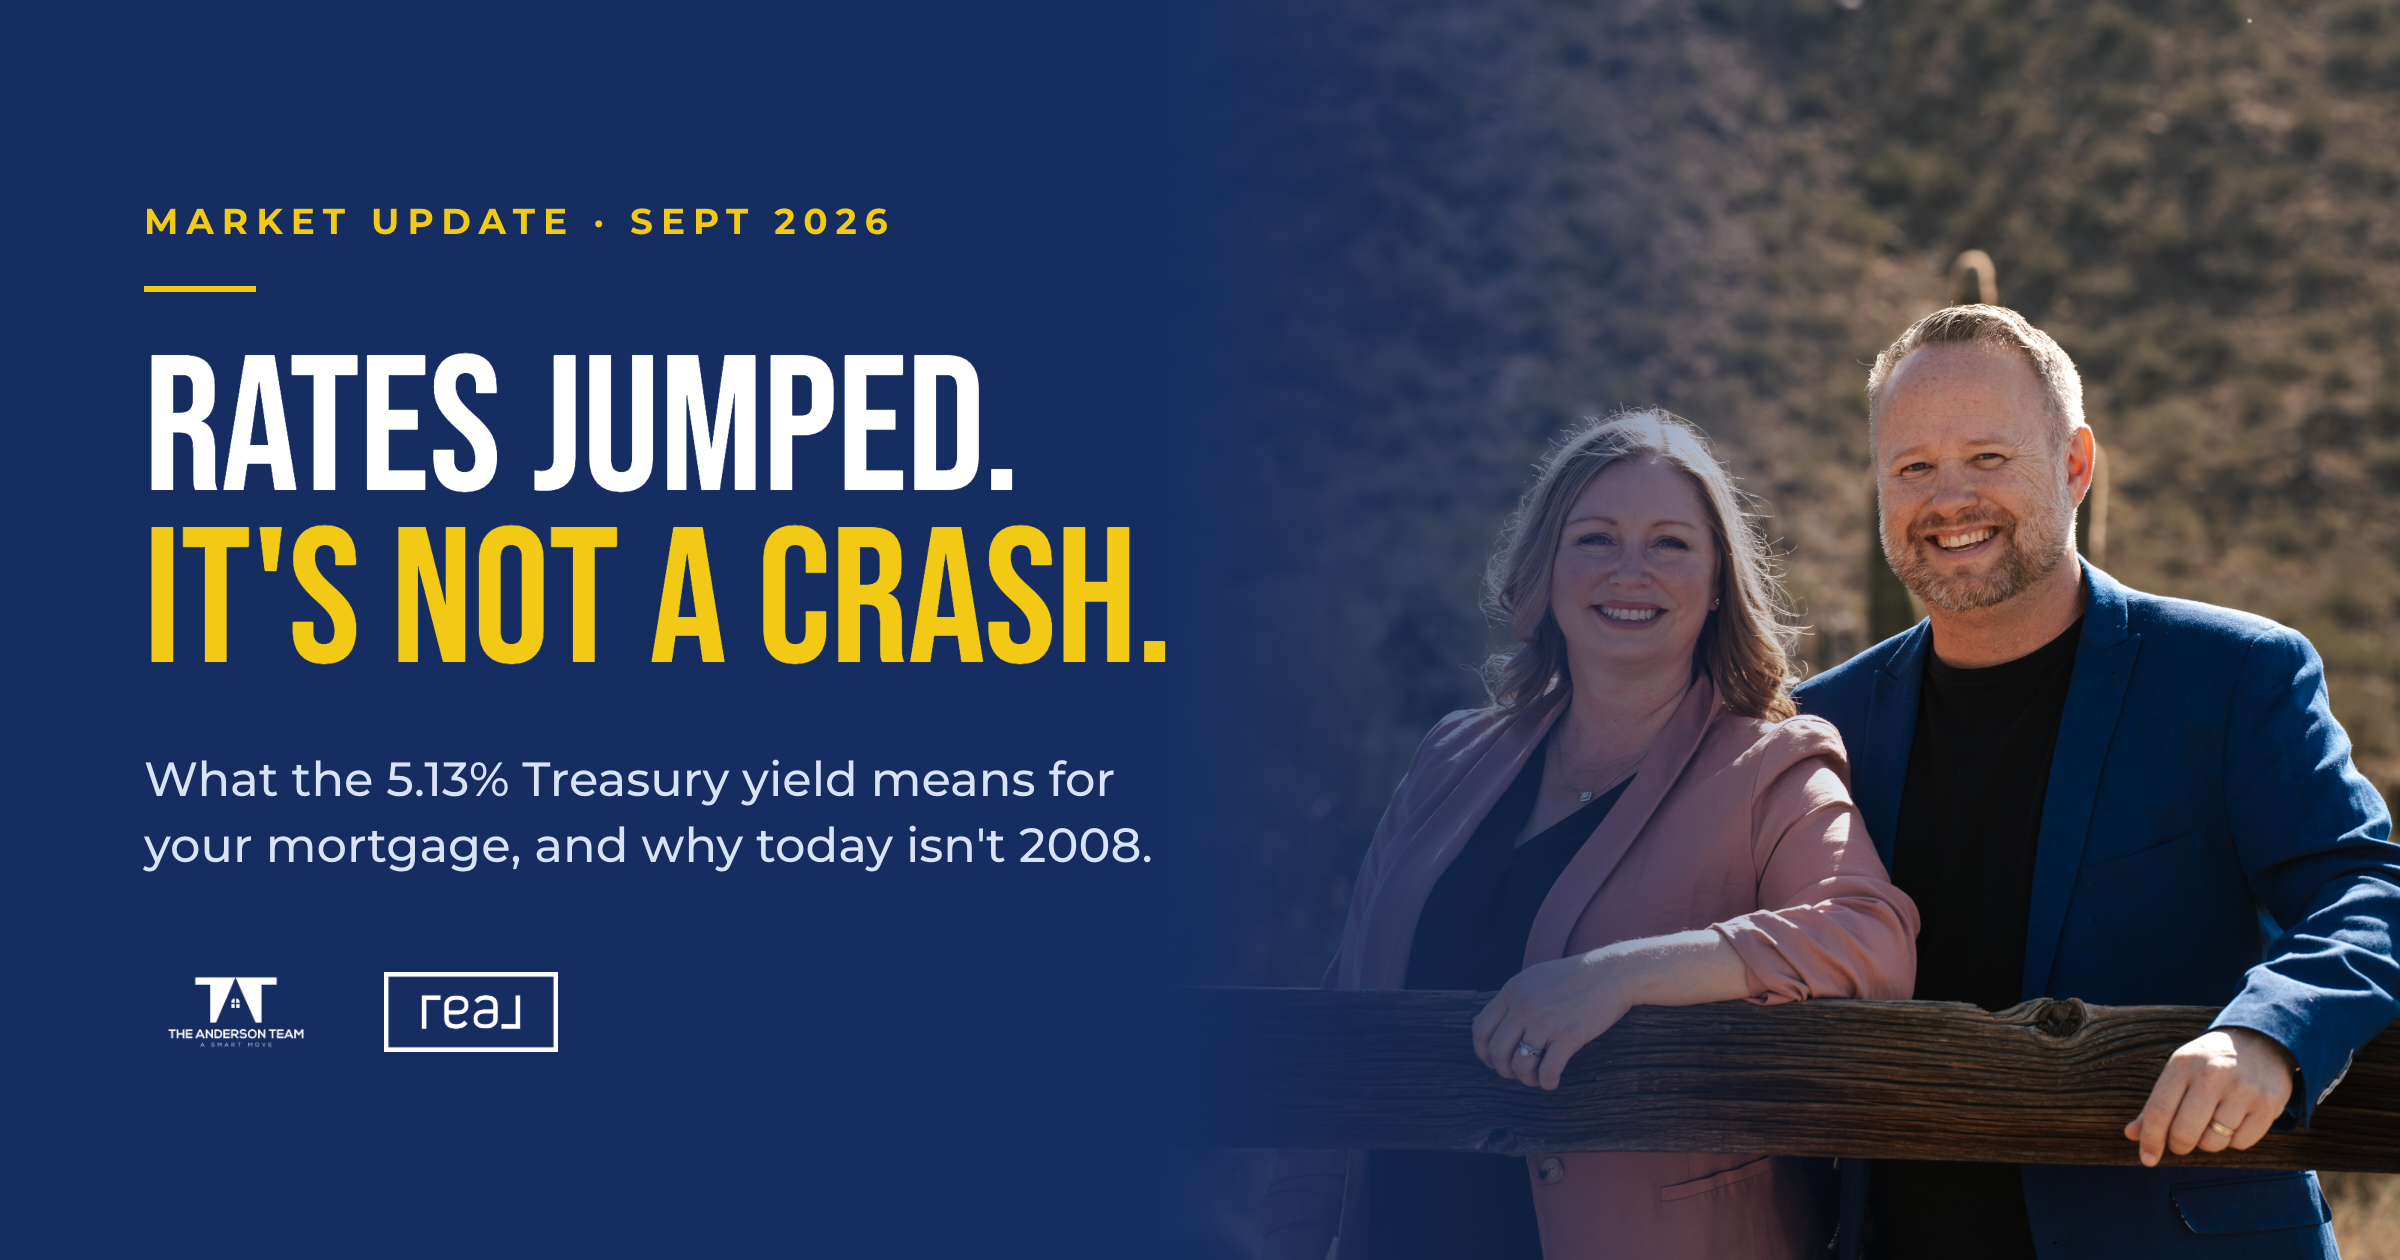
If your feed is full of "the market is about to crash" videos, take a breath. Here's what happened this week, what it means for your mortgage, and why today looks nothing like 2008.
The 10-year Treasury yield hit 5.13%
On Wednesday, the 10-year Treasury yield reached its highest level since 2007. That might sound like Wall Street jargon, but it matters to anyone buying or selling a home, because mortgage rates follow it.
• 10-year Treasury: 5.13%
• 30-year mortgage average today: 7.43%
• 30-year average one year ago: about 6.30%
Lenders price mortgages off the 10-year Treasury. When it climbs, your rate usually climbs with it.
Five things pushed rates up at once
1. The Fed hinted it isn't done. It may raise rates again to keep fighting inflation.
2. The economy came in strong. Good news for jobs. But a hot economy tends to keep rates higher.
3. The government borrowed big. It sold $70 billion in new debt and fewer investors wanted it. When demand is weak, rates go up to attract buyers.
4. Oil prices climbed. Tension around Iran kept inflation worries alive.
5. Global markets got shaky. Swings overseas added to the nerves here.
None of these are about housing itself. They're about inflation, government debt and world events. Housing feels the effect through your mortgage rate.
Higher rates aren't a crash
Yes, buying costs more right now. We won't sugarcoat that.
But a crash happens when lots of owners are forced to sell at the same time. That's what happened in 2008, and it's not what's happening now.
Why this isn't 2008
LENDING
2008: Loans were easy to get, even without proof of income.
Today: Borrowers have to prove they can pay.
EQUITY
2008: Many owners owed more than the home was worth.
Today: Most owners have built real equity.
MISSED PAYMENTS
2008: Missed payments were piling up.
Today: Fewer people are behind than before the pandemic.
FORECLOSURES
2008: Foreclosures flooded the market.
Today: Foreclosure sales are 46% below pre-pandemic levels.
Equity is the big difference. If an owner hits a rough patch today, most can sell and walk away with money in their pocket. They don't have to lose the home, and that keeps a wave of foreclosures from dragging prices down.
Here at home in the East Valley
National headlines don't always match what's happening in the Valley. Here's what our local numbers show.
• +5%: People are still buying. Greater Phoenix has more home sales this year than last, even with rates above 6%.
• +27,900: People are still working. Arizona added 27,900 jobs over the past year.
• 4.3 months: The market is balanced. About 4.3 months of homes for sale. Enough for real choices, not a flood.
Don't panic. Plan.
IF YOU'RE BUYING
You have more homes to pick from and more room to negotiate than a couple of years ago. Start with a monthly payment you're comfortable with, then shop from there. Ask about seller credits and rate buydowns, which can lower your payment.
IF YOU'RE SELLING
Buyers are still out there. Homes that are priced right and show well are still selling. Price to what's actually selling near you, not what a neighbor got in 2022.
Rates will move week to week. Next week's jobs and inflation reports will likely push them one way or the other. A scary headline shouldn't make your decision. Your numbers should.
Not sure what to believe?
That's what we're here for. Call or text us at (480) 900-9140 or DM us on Instagram and we'll walk you through what this means for you. No pressure, just straight answers.
Make It A Smart Move
Paul & Alisha Anderson
Sources: U.S. Treasury (10-year yield, Sept 24, 2026). Freddie Mac (year-ago 30-year average). ICE First Look (delinquencies and foreclosures, May-June 2026). ASREB Greater Phoenix report (sales through July 2026). Arizona Office of Economic Opportunity (jobs). ARMLS (months of supply, Aug 2026). Figures are approximate and change often. This post is general information, not financial advice.
The Anderson Team, Real Broker. 3707 E Southern Ave, Ste 1074, Mesa, AZ 85206. Equal Housing Opportunity.